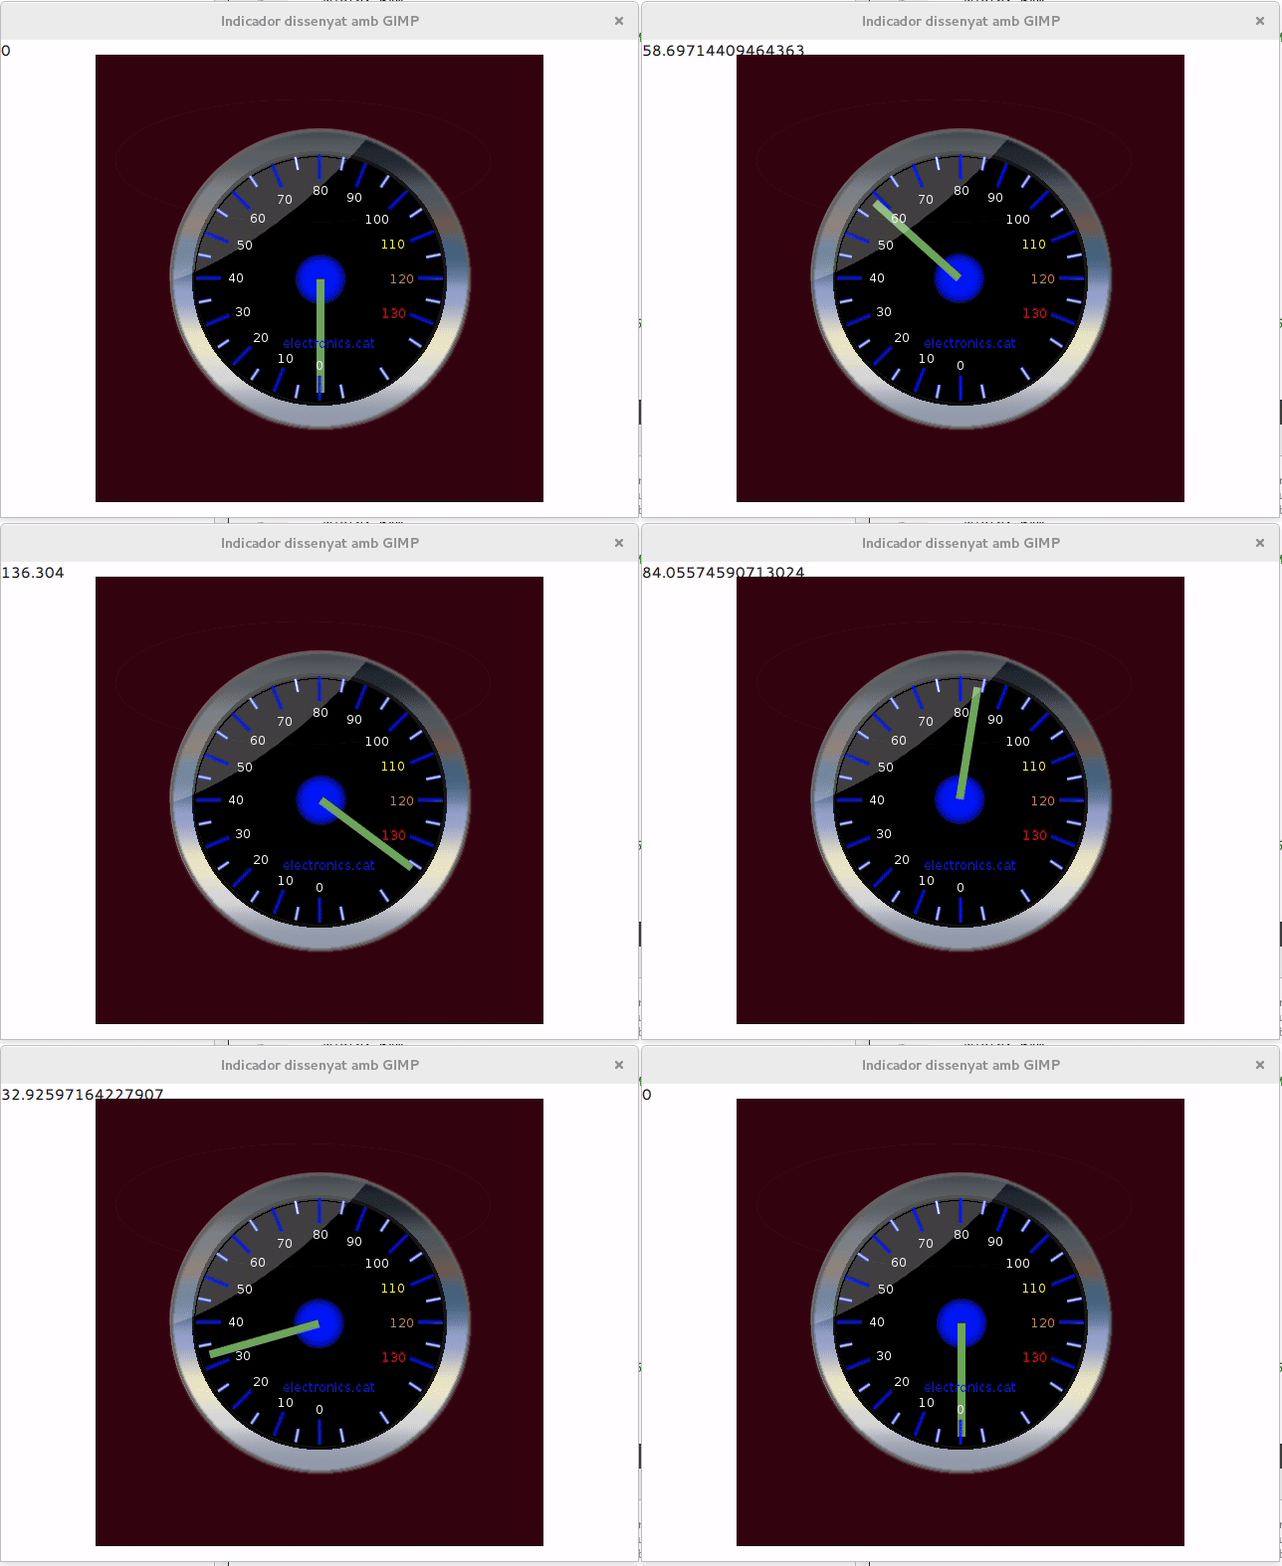
Making a QML gauge from GIMP
Contingut
Drawing a gauge using GIMP
Steps to create a speedometer gauge. It uses layerfx.2.8.py script. Once it has been downloaded, it should be copied at ~/.gimp-2.8/scripts folder giving execution permissions (chmod u+x layerfx.2.8.py ).
indicador00.xcf is a free version of previous tutorial.
Exporting from GIMP to QML
Download qmlexpoter.py at ~/.gimp-2.8/plug-ins folder giving execution permissions (chmod u+x qmlexpoter.py ).
Restart GIMP to have the export command added to the File menu. Choose File > Export to QML to export GIMP design to a QML file. In the Export Layers to a QML Document dialog, enter a name and location for the QML file, and click Export.
Indicador00.qml and Indicador00_images folder exported from indicador00.xcf
(Official info: Exporting from GIMP to QML from doc.qt.io )
Modifying exported QML file
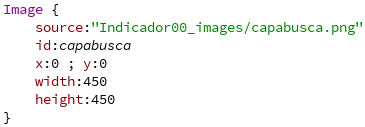
Original Indicador00.qml file.
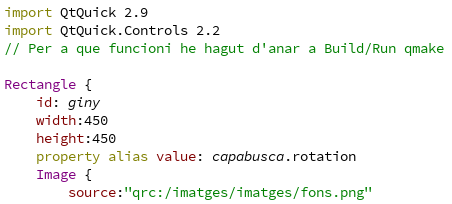
Copying Indicador00.qml to Indicador00.ui.qml and modifying some lines:
At the header swapping
import QtQuick 2.5
by
import QtQuick 2.9
import QtQuick.Controls 2.2
and all image paths starting by Indicador00_images/
source:"Indicador00_images/fons.png"
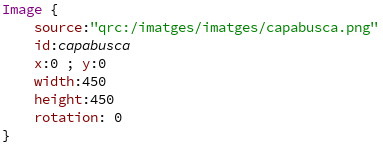
have been changed to qrc:/imatges/imatges/
source:"qrc:/imatges/imatges/fons.png"
Also it has been added an ID
id: giny
and a new alias property
property alias value: capabusca.rotation
To be able to rotate needle
has been added rotation property
capabusca comes from Catalan capa busca meaning needle layer
Giving values to gauge
I have taken advantage of QML dashboard example to generate dynamic values. In this project I am using ValueSource.qml Example File without any modification.
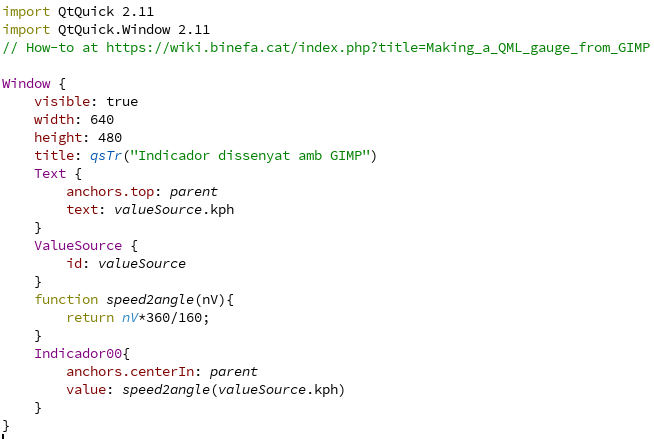
This is the main.qml:
Using ValueSource.qml
ValueSource {
   id: valueSource
}
and showing its kph value at top-left corner
Text {
   anchors.top: parent
   text: valueSource.kph
}
Gauge Indicador00 is centered and valueSource.kph is giving a value to speed2angle javascript function
function speed2angle(nV){
   return nV*360/160;
}
Indicador00{
   anchors.centerIn: parent
   value: speed2angle(valueSource.kph)
}
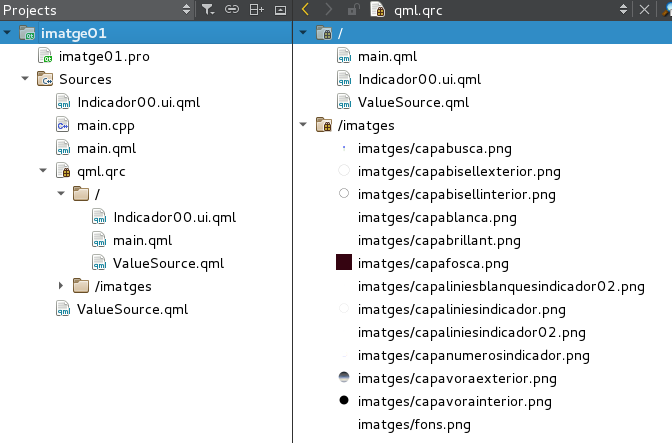
These are the qml.qrc contents:
Compiling and running
If after compiling you are not able to see the gauge, then try Build/Run qmake menu option and Run again.
If you want to try this app on Android you can download imatge01.apk and install it.
